1 Product Overview
The Data Collection Dashboard is a client software tool for data visualization report display on large - screen devices such as Windows systems and Android systems, launched by Shanghai Data Collection IoT Technology. It is a productivity tool that can be used out - of - the - box. It can be installed on industrial computers, Android boxes, conference tablet all - in - one machines, advertising machines and other devices.
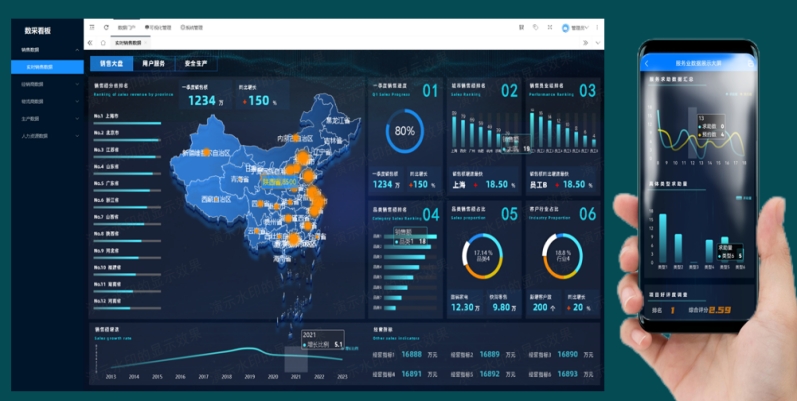
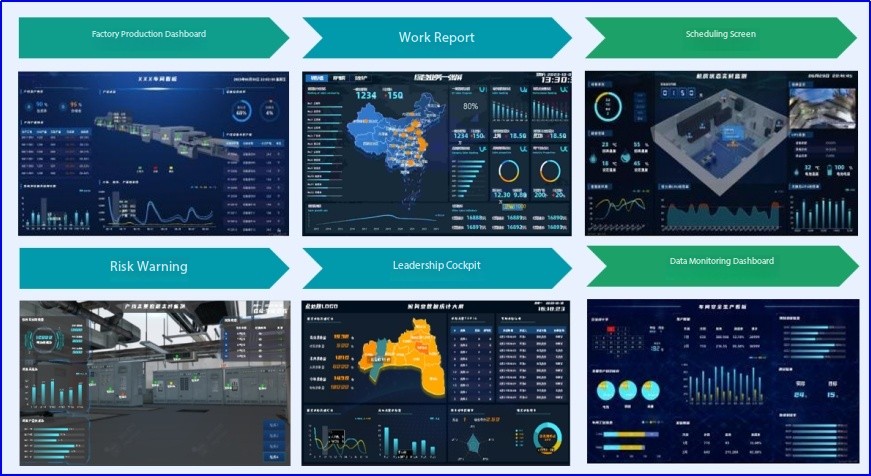
This product can help enterprise users easily implement data visualization viewing, and is used in scenarios such as report analysis, data reporting, leadership cockpit dashboards, IoT data display, industrial cloud configuration, and corporate promotion. The product can solve the following pain points: devices are scattered, and content maintenance is labor - intensive; large - screen devices are hung at high places, making it difficult to turn on/off and maintain content display; when content often needs to be changed or replaced, manual maintenance is not timely. It is especially suitable for private deployment scenarios.
The product supports importing data files such as EXCEL and CSV, system databases such as ERP and OA, and data from third - party system API interfaces. It can upload various resources including picture materials, fonts, audio - video resources, map data, and custom - developed pages for use in the Data Collection Dashboard software. The product supports drag - and - drop layout design, zero - code data binding, has dozens of built - in chart components, and supports display terminal devices with different resolutions such as PCs, mobile phones, and large - screen devices.
2 Service concept
Our company solemnly promises:
What you purchase is not just a product, but also meticulous and thoughtful technical support services!!! ( =^_^= )
For this product, on-site installation can be done by ordinary workers! No debugging is needed!
We provide free remote guidance and remote configuration and debugging services to send data to the cloud platform designated by the user.
Free consulting services for IoT solutions are also available!
3 Product features and advantages
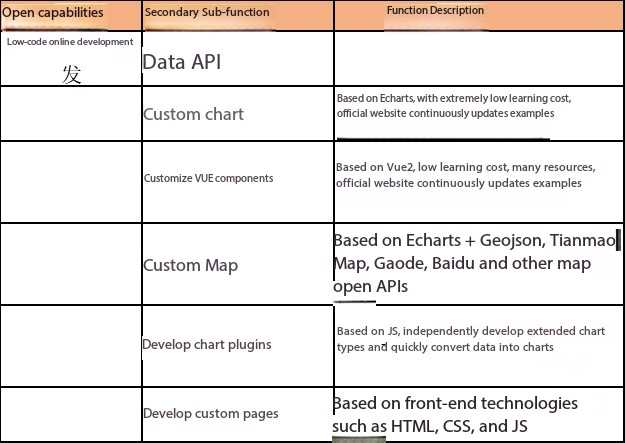
l Drag-and-drop design for quick response to ever-changing business needs; low-code secondary development to easily meet personalized requirements.
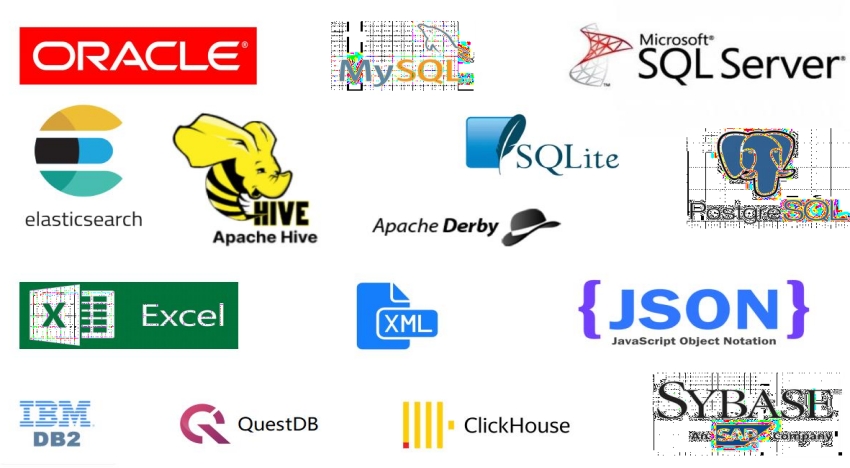
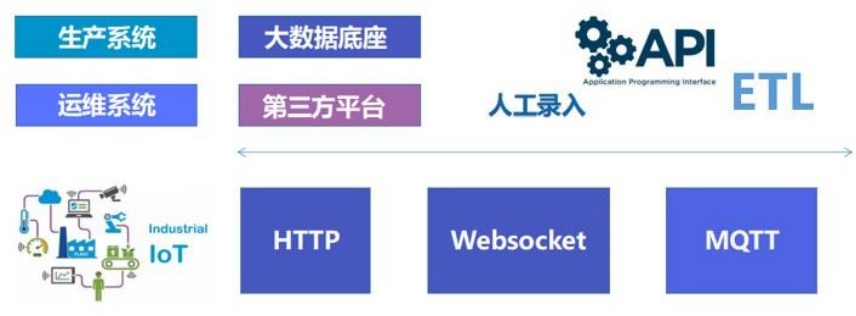
l Rich data sources: Relational databases, big data components, data files, external data APIs, Internet of Things, etc.
l Drag-and-drop design: Flexibly combine to design data visualization reports like a jigsaw puzzle, with what you see is what you get.
l Multi-terminal support: Support designing visual dashboards for different resolution display terminals such as desktops, mobile phones, tablets, and tiled screens.
l Configure interactions: Implement interactive requirements such as clicks, jumps, pop-ups, drill-downs, chart linkages, and data filtering through configuration.
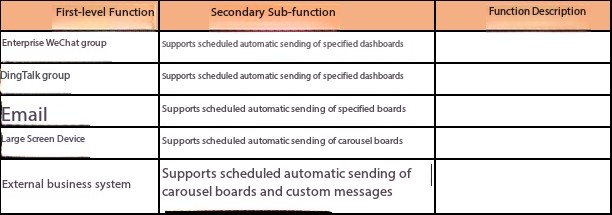
l Report push: Automatically push to channels such as enterprise WeChat groups, DingTalk groups, Email, and large-screen devices.
l Intranet private deployment: Take autonomous control of data security.
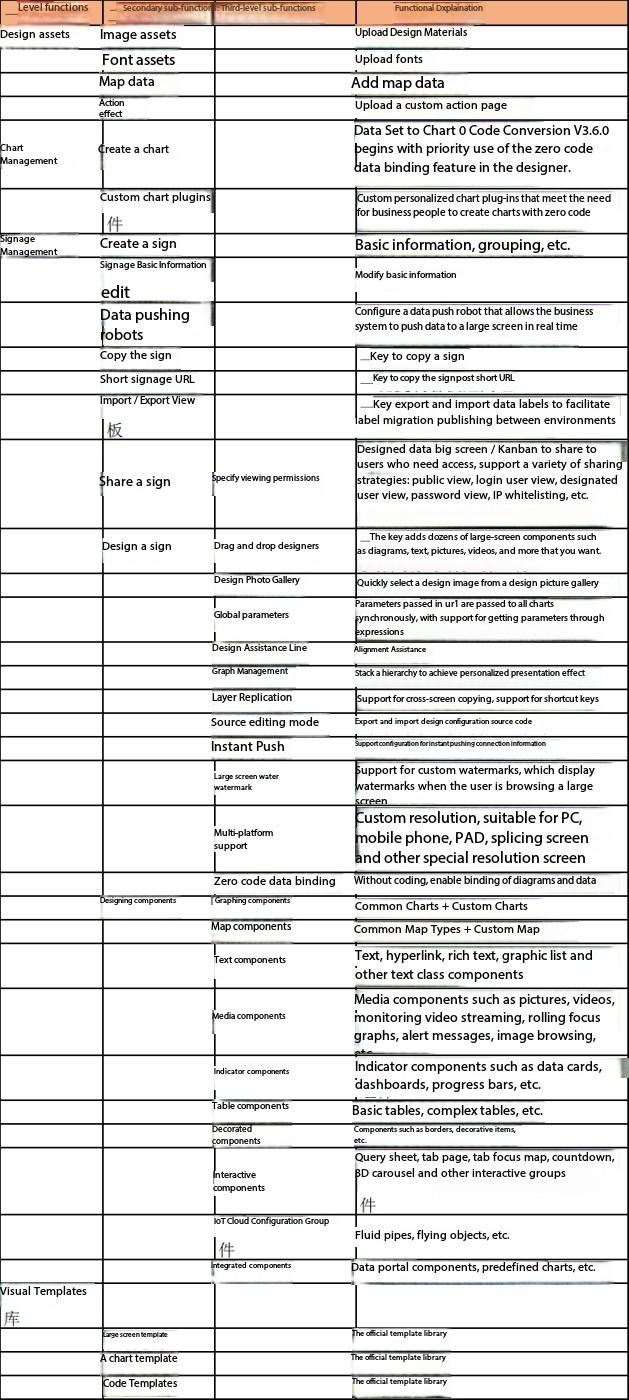
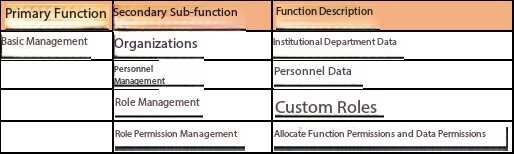
4 Product functions
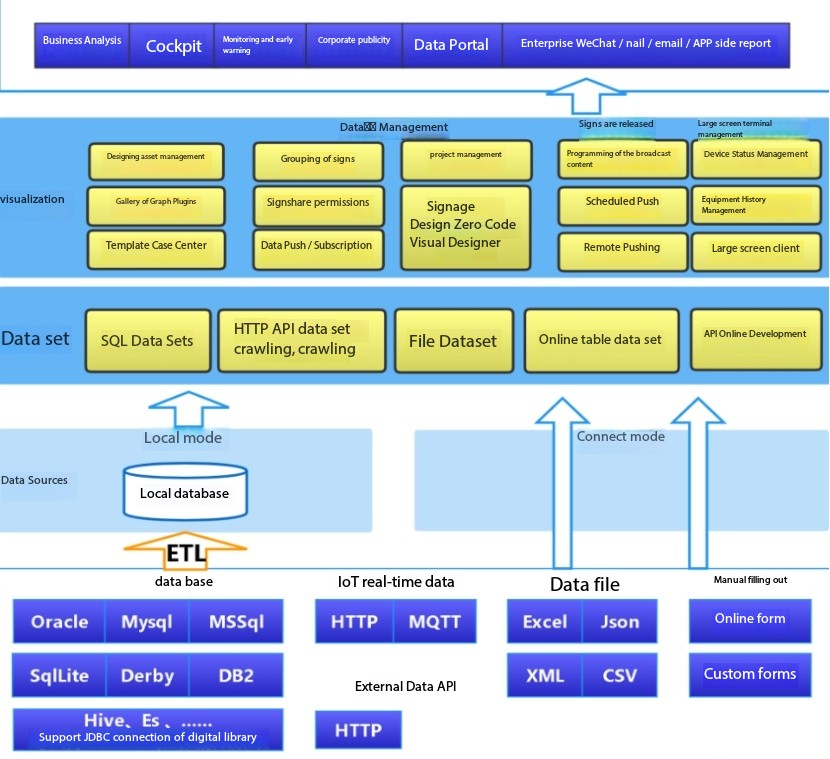
System functional architecture
4.1 Data access
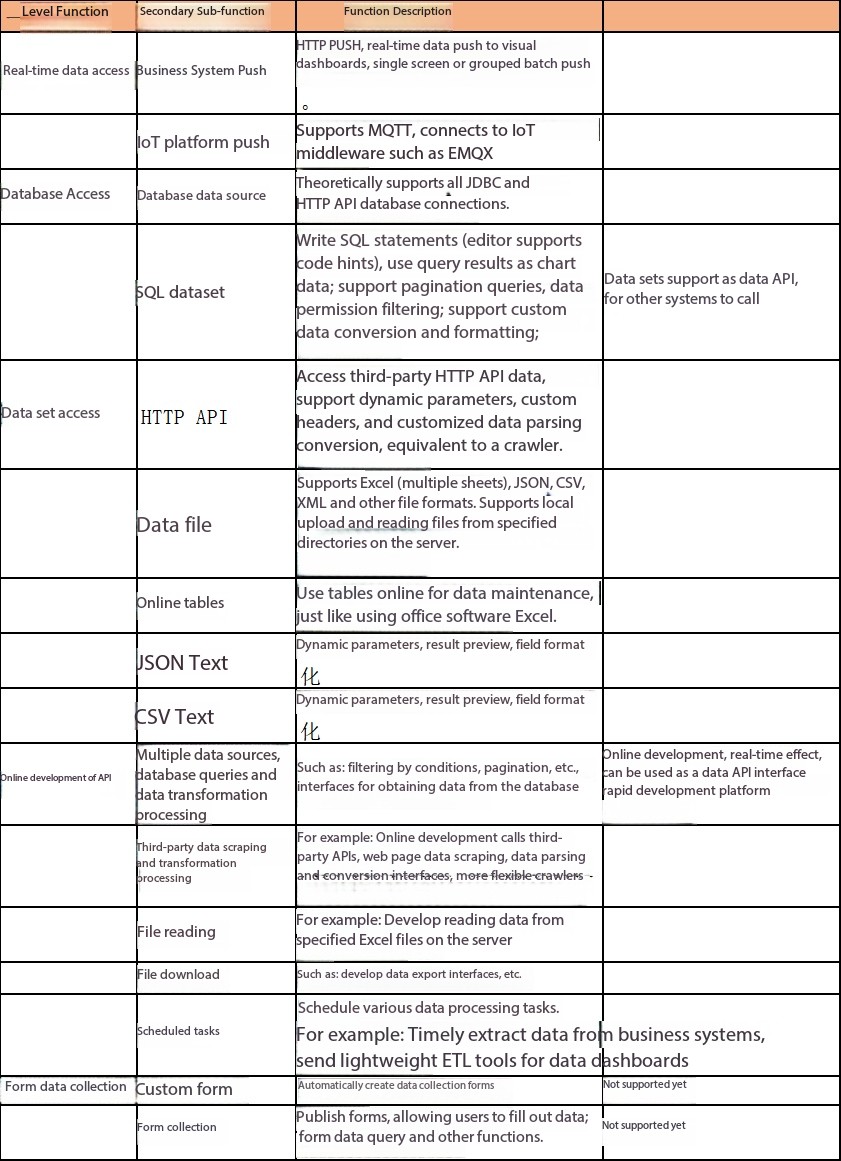
4.2 Visual design
4.3 Automatic push of data dashboard
4.4 Large screen display
4.5 Data Portal
You can view data reports anytime and anywhere in the mobile APP client.
4.6 Low-code expansion
4.7 System management
5 Project implementation process
The project implementation of this product can be divided into the following steps: data collection, design material upload, visual design, report release and other links.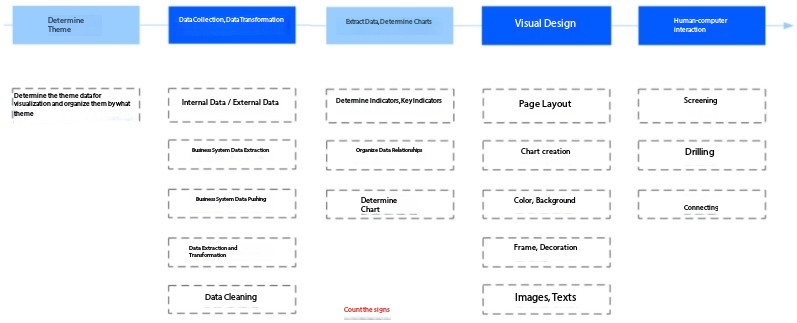
6 Typical cases
 ch
ch English