 ch
ch English

一、Project background and requirements
The project demanders are the affiliated units of Jiangsu Guoxin Group: Huajing Photovoltaic and Xinneng Haoyang. The project is located in Taizhou, Jiangsu and Yangzhou, Jiangsu, corresponding to a distributed photovoltaic power generation data acquisition project.
Project background: Data collection and development statistics of power generation of photovoltaic power generation grid-connected projects .
Requirements: Collect data from photovoltaic meters , integrate data, develop logical operations, and perform statistics on various power generation parameters of power stations on a daily, weekly, and monthly basis as required, solve the problem of manual calculations, present the data on the platform, and support direct download and presentation of data.
二、Specific implementation and development requirements
the State Grid electric meter, you can refer to previous implementation cases. We use our mainstream 4G infrared meter reading product ( SC-GP-IR4G) to achieve infrared collection .
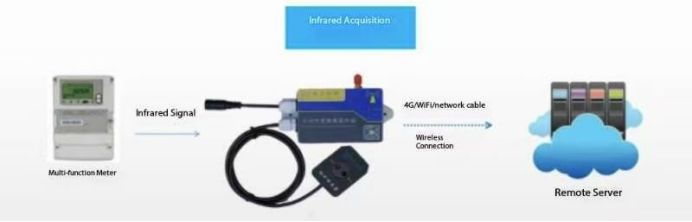
Electricity meter collection solution
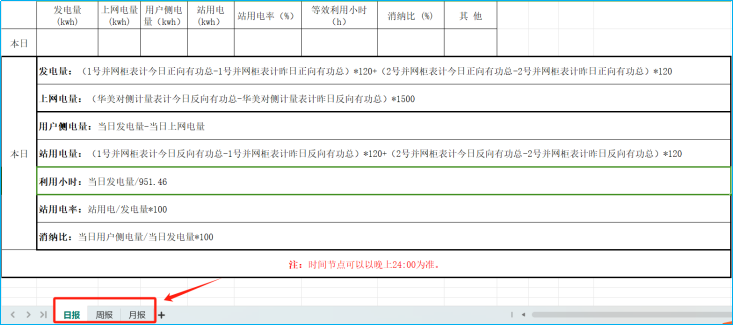
According to the conventionally collected meter values (total, peak, flat and valley active power in both positive and negative directions) and the requirements in the above figure, the platform can generate statistics on daily, weekly and monthly power generation, online power consumption, user-side power consumption, utilization hours, station power consumption rate and consumption ratio, etc.
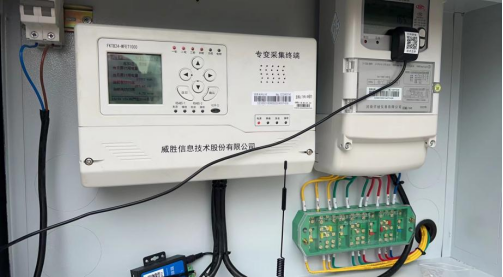
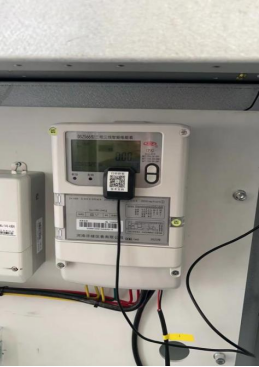
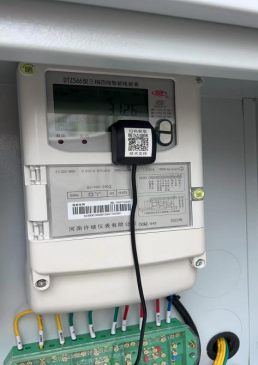
Installation Implementation Diagram
三、Data collection and data development final platform display
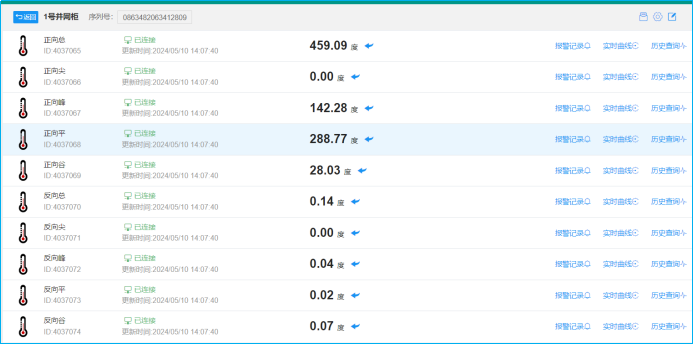 3.1 Conventional electric meter display
Electric meter data collection and display
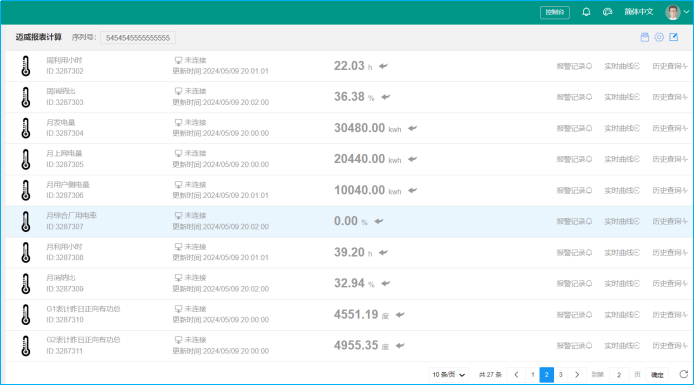
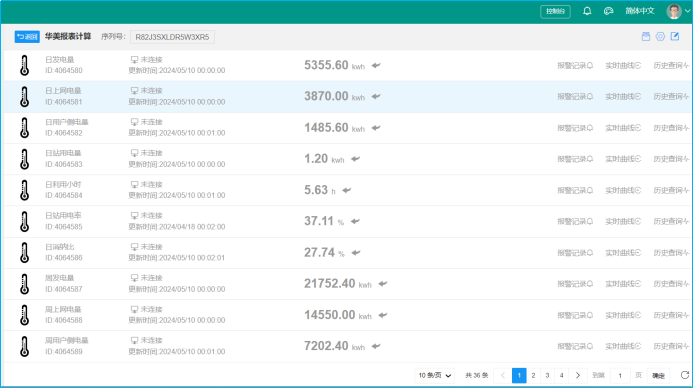
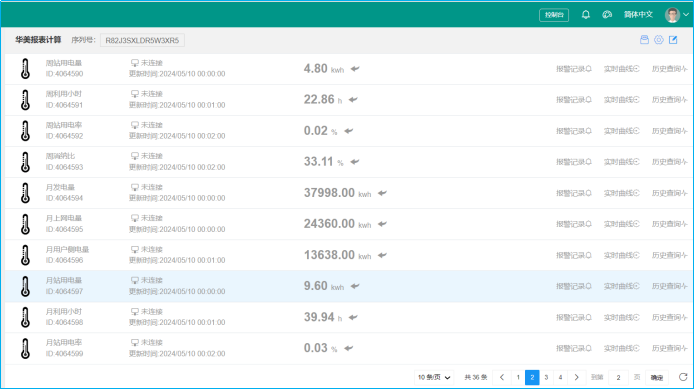
3.2 Development data such as daily, weekly and monthly power generation, online power consumption, user-side power consumption, utilization hours, station power consumption rate, and consumption ratio are displayed.
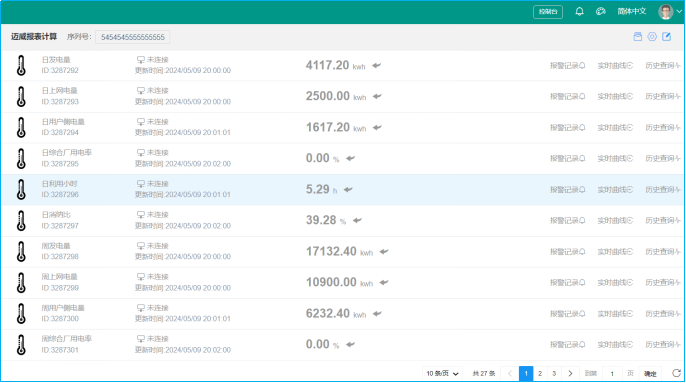
Huajing Photovoltaic corresponding to Jiangsu Taizhou data development report display
Xinneng Haoyang develops report display corresponding to Jiangsu Yangzhou data


